

Content marketing has become one of the most consistent and cost-efficient growth channels for modern organizations. Yet despite its impact, many teams still struggle to measure performance, understand benchmarks, or identify which content formats generate the strongest returns. As digital behavior evolves, marketers need clear data—not assumptions—to build a strategy that drives measurable business outcomes. This article highlights essential content marketing statistics and explains how these metrics translate into stronger content planning, performance, and revenue impact.
The State of Content Marketing Growth Today
Content marketing continues to expand rapidly as brands shift budgets toward organic acquisition and owned media. According to the Content Marketing Institute’s annual research, 71% of high-performing marketers increased their content output last year. This aligns with StatCounter’s global digital trends, which show rising content consumption across search, mobile, and social platforms.
Adoption & Investment Trends
DataReportal’s Digital 2024 report reveals upward trends in global content engagement, with video, educational content, and search-driven topics leading consumption. This increased demand pushes organizations to invest in:
- SEO-driven content hubs
- Short-form educational formats
- Multimedia assets (video, infographics, carousels)
- Research-backed content and long-form narratives
How Brands Measure Success
Growth-driven marketing teams rely on metrics such as:
- Organic traffic
- Engagement depth (scroll depth, dwell time)
- Conversion pathways
- Content-assisted revenue influence
- Lead quality
These measurements help brands connect content directly to pipeline growth, operational efficiency, and long-term ROI.
Core Content Marketing Statistics Every Marketer Should Know
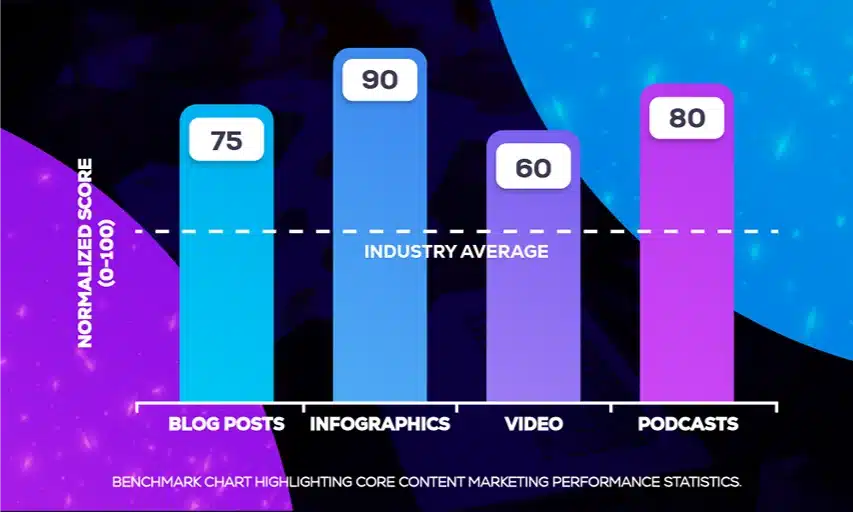
Engagement Metrics
DataReportal reports that the average internet user spends nearly 7 hours per day online, with content discovery through search and social ranking among the top behaviors. Meanwhile, the Reuters Institute notes that users prefer content that is:
- Action-oriented
- Expert-driven
- Easy to scan
Shorter, value-driven content formats see consistently higher engagement across channels.
Conversion & ROI Data
CMI findings indicate:
- 61% of marketers report improved lead quality from content marketing
- Organizations with a documented content strategy are 3× more likely to see strong ROI
- Consistent publishers generate substantially higher engagement and conversion rates
Brands that invest in search-optimized content through services like Growth Conductor’s Search Precision SEO Services see compounding returns as content ranks, builds authority, and continues generating traffic over time.
Content Marketing Trends Influencing Growth in 2026

Rise of AI-Supported Content
AI accelerates content creation, optimization, and audience analysis. Leading teams use AI to:
- Build topic clusters
- Generate insights
- Create content variations
- Optimize structure and readability
However, AI enhances strategy—it does not replace it. Human expertise drives differentiation and authority.
Shift Toward Short-Form Content
DataReportal confirms that short-form video remains one of the fastest-growing content formats globally. Brands use short-form clips to:
- Boost engagement
- Support long-form content
- Increase cross-platform visibility
Yet long-form content remains essential for ranking in search and building trust.
How to Apply These Statistics to Your Content Strategy
KPI Alignment
Teams should evaluate content success through business outcomes, not vanity metrics. Effective KPIs include:
- Pipeline influence
- Revenue contribution
- Lead quality improvements
- Organic acquisition savings
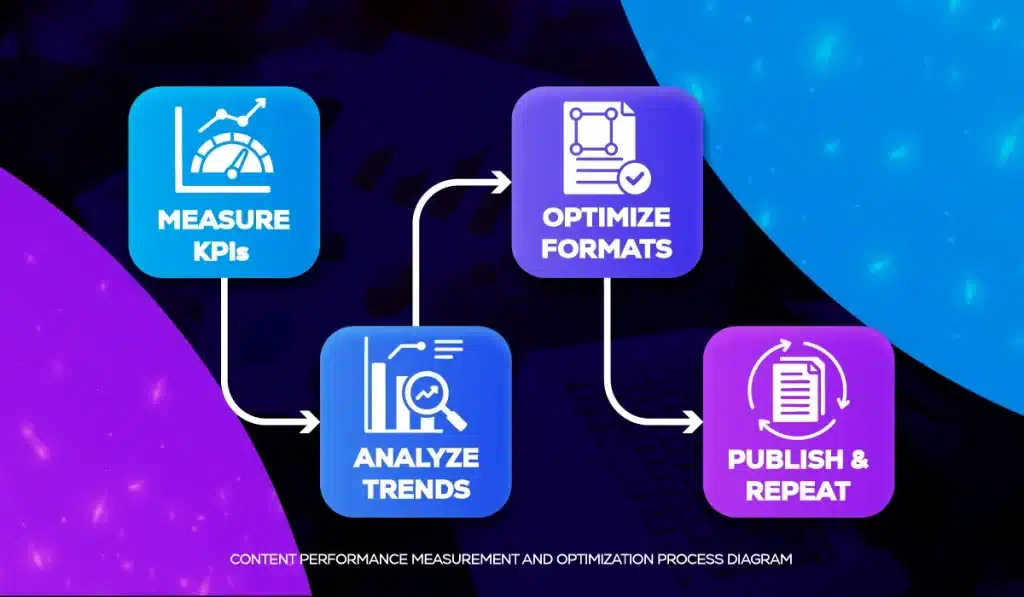
Performance Analysis Tactics
Use a recurring cycle:
- Measure
- Analyze
- Optimize
- Repurpose
- Scale
For businesses ready to operationalize data-backed content systems, Growth Conductor provides strategic support through Search Precision™ SEO Services and AdVelocity™ Performance Marketing.
Conclusion / Next Steps
Content marketing success relies on understanding what drives engagement, conversions, and long-term growth. The data shows that consistent, strategically aligned, high-quality content outperforms reactive or low-frequency content approaches. With global consumption increasing and search behavior shifting, brands that use statistics to inform planning will gain a measurable advantage.
If you’re ready to scale content performance with a proven, data-backed framework, Growth Conductor’s Search Precision SEO Services can help you build a personalized roadmap that turns insights into predictable growth.