
QUICK SUMMARY
TL;DR: Google Trends measures relative search interest over time — it shows you direction and momentum. Google Keyword Planner estimates absolute monthly search volume — it shows you demand size. They use entirely different calculation methods, pull from different data sources, and answer different questions. You need both. The trick is knowing which one to reach for first.
Most marketers have both tabs open at the same time. That doesn’t mean they’re using them correctly.
Google Trends and Google Keyword Planner are not the same tool dressed up differently. They measure fundamentally different things, use distinct calculation methods, and serve different stages of your keyword research workflow. Treating them as interchangeable — or worse, relying on just one — means you’re making content and campaign decisions with half the picture.
At Google Search Central Live Toronto in April 2026, Google’s Annanya Raghavan dedicated an entire session to Google Trends — clarifying exactly how it works, what makes it structurally different from Keyword Planner, and why that distinction matters for SEO and content strategy. This article breaks down what she covered, what it means for your workflow, and how to use both tools together to build a smarter keyword research process.
What Does Google Trends Actually Measure?
Google Trends does not show search volume. It shows relative search interest — a normalized score between 0 and 100 that represents how popular a query is compared to its own peak popularity over a selected time range. A score of 100 means the query was at its most popular. A score of 50 means it was half as popular as its peak. This relative index is what makes Trends useful for spotting momentum, not mass.
The distinction matters more than it sounds. When you see a keyword trending at 75 in Google Trends, that number does not mean 75,000 people searched for it. It means that keyword was at 75% of its peak interest for the time period and geography you selected. The actual search volume behind that score could be 500 searches per month or 500,000 — Trends doesn’t tell you which.
What Trends does tell you — and Keyword Planner cannot — is the shape of demand over time. Is interest in this topic rising, falling, seasonal, or flat? That’s the signal Trends is built to surface. You can explore the full details of how Google Trends normalizes and indexes search data in Google’s official FAQ.
Cross-Platform Data: Google Search and YouTube Combined
One of the most underused features of Google Trends — and a key point from Raghavan’s session — is that Trends aggregates data across both Google Search and YouTube. This makes it uniquely capable of showing you how audience interest in a topic behaves across the two largest search platforms in the world.
When you’re planning content for a topic, knowing that interest is high on YouTube but flat on Google Search (or vice versa) changes your format decision. A topic that’s spiking on YouTube is a video opportunity. A topic that’s trending on Search but underrepresented on YouTube may be a written content gap worth claiming early.
Keyword Planner does not cross-reference YouTube data. It’s Google Search only.
Why Google Trends Data Is Intentionally Delayed 48 Hours
Raghavan confirmed in her session that Google Trends data carries a deliberate 48-hour lag. This is not a technical limitation — it’s an intentional design decision. The delay exists to prevent spammers from gaming trending topics in real time, which would corrupt the signal and make Trends unreliable as an interest indicator.
For most content strategy use cases, 48 hours is irrelevant. You’re not making editorial decisions on the hour. But it’s worth understanding if you’re using Trends to monitor a rapidly developing news story — the picture you’re seeing is two days behind real-time activity.
“Google Trends shows you the shape of demand. Keyword Planner shows you the size. Both answers matter — and neither tool gives you both.”
Understanding what Trends actually measures is foundational to using it well. The cross-platform interest data — when paired with the E-E-A-T signals that support content credibility — gives you a stronger basis for topic selection than search volume alone.
What Does Google Keyword Planner Actually Measure?
Google Keyword Planner provides estimated monthly search volume — the projected number of times a keyword is searched on Google per month. Unlike Trends, these are absolute numbers (or volume ranges), not relative scores. The data is derived from Google’s ad auction infrastructure and represents historical demand averages, making it the right tool for validating that a keyword has enough search traffic to justify content or campaign investment.
Where Trends tells you direction, Keyword Planner tells you magnitude. A topic might be trending upward in Trends — but if Keyword Planner shows it averaging 90 searches per month, the audience may be too small to prioritize in a competitive content calendar. Conversely, a flat trend line in Trends paired with 40,000 monthly searches in Keyword Planner signals a mature, stable topic worth owning.
Keyword Planner is also the tool you need for paid search. It provides cost-per-click estimates, forecasts for budget planning, and keyword groupings that map to ad structure — none of which Trends is designed to support.
How Keyword Planner Calculates Search Volume
Keyword Planner pulls its data from Google’s advertising infrastructure — specifically, the query data that flows through the Google Ads auction system. Monthly estimates are calculated as rolling 12-month averages, which smooths out short-term fluctuations and gives you a stable baseline for planning. Google’s official Keyword Planner documentation outlines the full scope of what the tool provides, including search volume estimates, competition data, and forecasting capabilities.
Raghavan’s session explicitly noted that Keyword Planner’s calculation methodology is entirely separate from Google Trends. The two tools do not share a data pipeline. Trends normalizes relative interest using its own proprietary scoring system. Keyword Planner aggregates auction volume using its own methodology. This is why you can’t directly map a Trends score to a Keyword Planner volume — the numbers aren’t on the same scale and weren’t designed to be compared directly.
Volume Ranges vs. Exact Numbers
One practical limitation worth knowing: Keyword Planner groups low-volume keywords into ranges (such as “100–1,000” or “1K–10K”) rather than exact figures, particularly for terms with limited search activity. If you’re evaluating a niche keyword with fewer than 1,000 monthly searches, Planner may not give you the precision you’re looking for.
Access also requires an active Google Ads account. You can create one without running ads, but the account is required to access full volume data. Without it, estimates are heavily rounded.
How Are Google Trends and Keyword Planner Different? (Side-by-Side)
The core difference comes down to what each tool was built to answer. Google Trends answers: “Is interest in this topic growing or shrinking, and when does it peak?” Google Keyword Planner answers: “How many people search for this keyword each month, and what does it cost to target them?” These are related questions — but they require different data, different methodologies, and different interpretations.
The table below captures the key structural differences between the two tools. Understanding these distinctions is what separates marketers who use keyword data well from those who use it confidently but incorrectly.

The calculation methodology distinction is the one most often overlooked. Because both tools live inside Google’s ecosystem, it’s easy to assume they’re drawing from the same pool of data and presenting it differently. They’re not. As noted in the Google Search Central Live Toronto session, Trends and Keyword Planner use separate systems with distinct methodologies — which is exactly why the same topic can look very different depending on which tool you’re looking at.
This structural difference is also why the commodity vs. non-commodity content distinction matters so much in how you interpret the data. A keyword with high Planner volume but flat Trends momentum is a saturated topic — the kind where commodity content already dominates. A keyword with rising Trends momentum but modest Planner volume may be the non-commodity opportunity worth moving on first.
When Should You Use Google Trends vs. Keyword Planner?
Use Google Trends when you need to understand momentum, timing, or cross-platform interest. Use Google Keyword Planner when you need to validate demand size, estimate traffic potential, or plan a paid search campaign. Neither tool answers both questions — and using the wrong one for the wrong job produces misleading data that leads to poor content and budget decisions.
Use Google Trends When You Need To…
- Identify emerging topics before they reach peak search volume in Keyword Planner — Trends shows momentum early; Planner shows it after the fact
- Plan seasonal content — Trends reveals exactly when interest spikes year over year, so you can publish ahead of the curve rather than during it
- Validate whether a topic resonates on YouTube AND Google Search — critical for deciding between video and written content formats
- Spot Breakout queries — topics showing explosive growth that signal a category shift worth moving on quickly
- Compare the relative popularity of 2–5 competing topic angles — useful when choosing between keyword variants or content directions
- Monitor geographic interest — understand where demand for a topic is strongest before investing in location-specific content
Use Google Keyword Planner When You Need To…
- Confirm that a trending topic has enough search volume to justify content investment — Trends shows direction; Planner confirms whether the audience is large enough
- Build a keyword list with searchable monthly volume thresholds for content or campaign prioritization
- Forecast paid search budgets — CPC estimates and impression forecasts are Planner-only capabilities
- Discover long-tail keyword variants with documented search demand for cluster content planning
- Validate keyword intent at scale — Planner’s keyword groupings help identify whether a topic maps to informational, commercial, or transactional intent patterns

What Are Breakout Queries — And Why Do They Matter for Your Content Strategy?
A Breakout query in Google Trends is a search term showing more than 5,000% growth in interest over a short period. Instead of displaying a percentage, Google simply labels these queries “Breakout.” They represent topics where search interest has surged so dramatically that a standard percentage figure would be misleading. For content strategists, Breakout queries are one of the most actionable signals in the entire keyword research toolkit.
Raghavan highlighted Breakout queries as a key feature during her Google Trends session — and for good reason. They surface category shifts before they register in Keyword Planner’s historical averages. By the time a Breakout topic shows meaningful volume in Planner, the early content window may already be closing.
The opportunity is straightforward: when a Breakout query appears in a topic area you cover, that’s a signal to act before your competitors do. You can’t always predict which queries will break out — but you can monitor your category regularly and move quickly when they do.
How to Use Breakout Queries in Practice
- Open Google Trends and search your primary topic category
- Scroll to the “Related queries” section and filter by “Rising” — Breakout queries will be labeled explicitly
- Cross-reference any Breakout queries in Keyword Planner to gauge current volume — low volume now with explosive trend momentum is often the best early-entry signal
- Build content around the Breakout query before it peaks — publishing during the rise, not at the top, is where first-mover advantage lives
- Revisit every 2–4 weeks for categories where trend velocity matters
“Breakout queries show you where the audience is going before the volume data catches up. That gap — between momentum and mass — is where smart content strategy lives.”
How to Use Google Trends and Keyword Planner Together
The most effective keyword research workflow combines both tools in sequence: use Google Trends to identify rising interest and directional momentum, then use Keyword Planner to confirm whether the demand is large enough to act on. This two-step process gives you both the timing signal and the volume validation — the two data points you need to make a confident content investment decision.
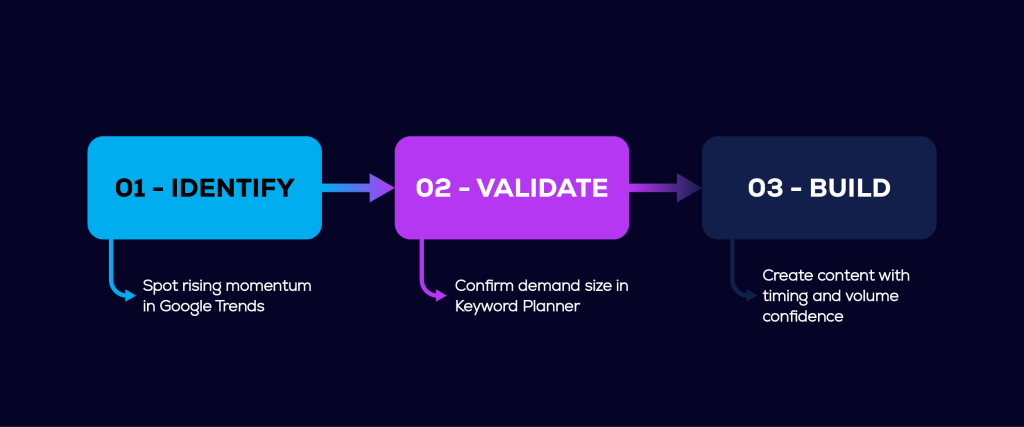
The Three-Step Workflow
- Step 1 — Identify in Google Trends: Search your category in Trends and filter Related queries by Rising. Note any Breakout queries or topics showing consistent upward momentum over 90 days or longer.
- Step 2 — Validate in Keyword Planner: Take the rising topics from Trends and run them through Keyword Planner. Check monthly search volume, competition level, and seasonal patterns. Filter out topics where demand is too thin to justify the content investment.
- Step 3 — Build content with intent: For topics that pass both filters — rising momentum in Trends, sufficient volume in Planner — build content immediately. Use the timing data from Trends to determine publish priority. The goal is to publish during the rise, not at the peak.
This is the same workflow built into Growth Conductor’s Content Engine keyword strategy phase. Before a single outline is drafted, topic selection runs through both data signals — directional momentum from Trends and volume validation from Keyword Planner — so every piece of content is backed by evidence, not assumption. Google’s own Search Central guidance on using Trends for content strategy reinforces this approach — identifying rising interest before building is the methodology Google itself recommends for content planning.
It’s also the workflow that produces non-commodity content. When you identify a topic during its momentum phase — before it’s saturated — you have the space to write with specificity and depth instead of competing against a hundred near-identical articles on a mature keyword.
Frequently Asked Questions
No. Google Trends and Google Keyword Planner are separate tools with distinct data sources and calculation methods. Trends shows relative search interest on a normalized 0–100 scale drawn from both Google Search and YouTube. Keyword Planner shows estimated absolute monthly search volume derived from Google’s ad auction data. They answer different questions and should be used at different stages of keyword research.
Not quite. Google Trends carries a deliberate 48-hour data lag — a design decision confirmed by Google’s Annanya Raghavan at Google Search Central Live Toronto in April 2026. The delay is intentional: it prevents spammers from gaming trending topics in real time, which would corrupt the interest signal. For most content strategy decisions, a 48-hour lag has no practical impact.
Yes. Google Trends aggregates data from both Google Search and YouTube, making it one of the only free tools that gives you cross-platform search interest data. This is particularly useful for deciding between written and video content formats — if a topic is trending heavily on YouTube but flat on Google Search, that’s a strong signal to prioritize video production over a blog article.
A Breakout query is a search term that has increased in interest by more than 5,000% over a short period. Google Trends labels these queries “Breakout” instead of showing a percentage, because the growth rate is too large for a standard figure to be meaningful. Breakout queries are early signals of category shifts — topics gaining explosive traction before they show significant volume in Keyword Planner.
They measure different things, so accuracy isn’t the right frame. Google Trends is accurate at showing relative interest and trend direction. Keyword Planner is accurate at estimating monthly search volume. Neither is “better” — they’re tools for different questions. Using Trends to estimate volume, or Keyword Planner to assess momentum, produces unreliable conclusions regardless of how precise the data appears.
Yes. Google Keyword Planner requires a Google Ads account to access. You can create an account without running any paid campaigns, but the account login is required to see full keyword volume data. Without it, search volume estimates are heavily rounded and less useful for strategic planning. Google Trends, by contrast, is completely free and requires no account.
Key Takeaways
- Google Trends measures relative search interest (0–100 index). Google Keyword Planner measures absolute monthly search volume. They use separate calculation methods and cannot be directly compared.
- Google Trends pulls data from both Google Search and YouTube — making it the only free tool that shows cross-platform search interest. Keyword Planner covers Google Search only.
- Google Trends data carries an intentional 48-hour lag to prevent spam manipulation of trending topics. This does not affect most content strategy use cases.
- Breakout queries — topics showing more than 5,000% interest growth — are one of the most actionable signals in Trends. They surface category shifts before volume data catches up in Keyword Planner.
- The strongest keyword research workflow uses both tools in sequence: Trends for momentum and timing signals, Keyword Planner for volume validation. Together, they eliminate the two biggest failure modes in keyword research — chasing thin trends and building content on declining demand.
- Neither tool replaces the other. Marketers who use only one are making decisions with incomplete data.
READY TO BUILD CONTENT THAT’S BACKED BY DATA?
Not sure which keyword signals to trust — or how to turn trend data into a content plan that actually ranks? Growth Conductor’s Content Engine handles the research layer so your team can focus on the writing. Every topic we build starts with both data signals — momentum and volume — before a single outline is drafted.
Learn more about Content Engine — Growth Conductor’s SEO content service.